Browsed by
Tag: data

The future is data

The future is data

The more I find my way in the digital landscape, the more I start to realise how much data becomes part of our daily live.

Without releasing most of our choices are made by data. Not only Google serves you what they think you need to see (based on your data), but also most of the websites and apps you daily visit.

Based on what you’ve seen before, they will serve you a website/app that shows you what you want (at least what they think you want). But not every algoritme servers the user what they want. Take for example YouTube; lately users (content creators and viewers) are unhappy about the new YouTube algoritme. The algorithm doesn’t show their favorite channels anymore and content creators are losing views because of it. “The goals of YouTube’s search and discovery system are twofold: help viewers find the videos they want to watch, and maximize long-term viewer engagement and satisfaction.”

So how does the algorithm work?
YouTube does not reward videos with the most views. Instead, videos with the most watch time are ranked more highly on the algorithm. This metric is important because it more accurately measures how engaging users find a video. This seems pretty fair, but its sounds better than it actually works. I don’t know how they can do I better, but I do know that as an user (viewer) I don’t get the videos suggested that I would like to see.

But not only YouTube has unhappy users, Instagram has the same problem, booth platforms try to optimise there algorithm for their users, not always for the better. Although it’s kind of has to do with what type of user you are. Most of the problem are for the creators/influencers. Booth platforms are mostly created for viewing (and some interaction), not realy for creating content big times and making lots of money on it.

The reason I wanted to right this post is just that. Data creates types of users where algorithms react to, but most of the time that is a bigger part of the users or a view specific target groups. Because of that a lot of other user are left out. Websites like Booking.com try to help you by optimising the website to your needs, but do they really know your needs??

We are humans, not computers. Most of our decisions and needs are based on emotions and feelings, an algorithm can’t barely read. With the help of psychology and lot of testing where are getting closer to letting algorithmes read emotions based on a lot of measurements but their are definitely not there jet. I want YouTube to know what videos make me happy, and when I need that video (on an off day).

Lately I started working more as a UX’er and I find myself struggling a lot with the fact that there are not just a view user groups. Me as a person likes to please everyone, but I know that as UX’er that is close to impossible… Or is it?? I hope in the near future UX’ers can create user experiences for all user, based on data, with stuff like feeling and emotions being part of that. I think UX’er should become more data visualizers/translators making the best experience for every user. Giving them what they really need.

And as long as we are not there jet, internet please let me make my own choices.
(people love searching and discovering, so let them)    

Internet of things day(s) – Lorna Goulden

Internet of things day(s) – Lorna Goulden

These last two days I were the internet of things day(s) in Rotterdam. Sadly I could only go one day, and here’s what i learned.

The first day was about Privacy & Security and Date & The self, we started with an introduction lecture from Lorna Goulden, called; “Iot: Are we being smart?” She talked about the value of things on the internet and that are connected to it. The internet once was made to give us insight but lately we’re giving it more insight, by putting all our data out there. She showed a part off the video underneath, where they explain the internet of things, where there are almost more things connected than people.

Lorna says that the thing give the internet data but what is even more important is the people. So to make the internet of things relevant we need to change the way we think and most definitely the way we create. We need to design it for the users, make everything understandable and adjustable for them. If we let the user be creative on/with the internet, stuff can be created that right now we can not even imagine.

But that is of course all the good for the users, there is also the bad, she calls out adblocker en advertising. What makes me as a advertiser think “are we the bad guys of the internet?”. Do I as advertising need the think on a way that people don’t say advertising as a bad thing. For me I feel that power lies in giving people the most insight of what we’re giving them and why. With data and the internet of things we can make advertising is little annoying as possible. The funny thing is after disliking advertising Lorna talks about this new privacy policy where the government is working on; GDPR (general data protection regulations), it’s a new law that will protect our data. Than she tells us how she thinks that user should get more insight on the data that is taken from them. She refers to the book “Weapons of math destruction” by Cathy O’Neil. The book is about most of us dont understand algorithms but they do start controlling our lives. She show’s dis video underneath the perfectly shows how the algorithms do that and how we can change that around for the better.

So a thing that I think is already important for my graduation project is showing the user how my algorithm works. How it collects data, how it makes choices and then put them into action. For me is giving that kind of insight to user was already very important, but hearing it from a person who knows way more of the internet gave me a feeling that I was on the right track and I need to put my drive into my work.

She ended her presentation with people trying to cheat the internet, starting of with a story about a primary school where kids got bracelets that tracked there stepps. And every 1000 steps a amount of money wash donated to kids in africa. So when the interviewer came to the school to see how the kids were doing, the kids found lots of ways to cheat the system. The children he talked to were waving the hand with the bracelet on it, and some actually made little machines from lego that shufelt the bracelet along. The kids were eager to help the children in africa but not by being more active like planned, but by being very creative. The last example Lorna gave was maybe the best. It’s this video of a elderly men how needs to watch his health, in order to do that his kids gave him all kinds of smart stuff that will track his habits when they’re not there, and well that didn’t worked out as planned.

Lecture BNO IMG LAB #63 Vormule – Het Nieuwe Instituut

Lecture BNO IMG LAB #63 Vormule – Het Nieuwe Instituut

Today I decided to go to a lecture mathematical/algorithmic design in Het Nieuwe Instituut Rotterdam. The invited four speakers, each of them did something computer generated design. So i’m going to tell what they talked about and how I’m feel about their work.

Pieter Schreurs – parametric design
Pieter is some sort of an artist/architect who designs his work with the help of math algorithms and programming. He first worked for seven years at ONL and now he works at RHDHV.

The first project he talked about, was a project he’s now working on. He programs this project in the program Grasshopper. Grasshopper is a graphical algorithm editor tightly integrated with Rhino’s 3-D, you can 3D model your design and gather the data out of tests to see where your design needs work. (He’s working on this project for RHDHV).

Then he talked about the “Parametric climbing wall”

This was also first made in grasshopper, where they could see which constructions worked the best. But they wanted to co-created with their clients, so they build a tool where they could adjust the model in meetings with the client. Later on they turned the tool into a web-app, so their client there clients could do it easily themselves.

Julius Horsthuis – visual effects designer and fractal artist
Julius has his own studio where he creates Fractal Architecture whith the help of the program called Mandelbulb 3D. Mandelbulb 3D is a free software application created for 3D fractal imaging. Developed by Jesse and a group of Fractal Forums contributors.

The program creates a space world where you can direct yourself through the world with the help of some 3D programming skills. Julius comes from the film world so that is why he also created tripie videos and on his website you can also see them in VR.


Rogier Arents – Graphic designer
Rogier was the guy hwo made the work I actually hoped to see at the lecture. He is a designer hwo makes pretty stuff by programming it. He started his presentation with chalk line. [www.rogierarents.com]

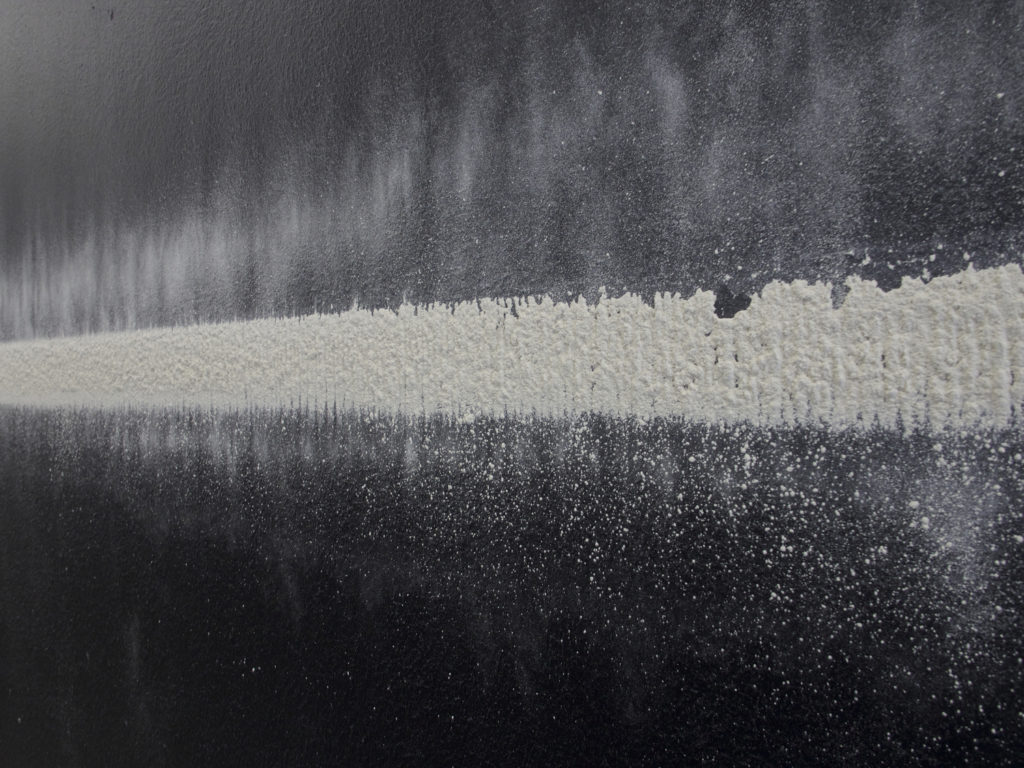
Chalk line is created with the use of a simple (not programmed) tool for construction workers, the tool is only a string of cotton and chalk, putting the string where you want the line and pull the string back and tada.. a line. Then he showed us his graduation project he made at the Design Academy Eindhoven in 2012 called Secret Signals.

This is such a cool project, inspired by nature, designed by a human on a computer and printed with a plotter. First of the story of the film is pretty cool, it’s about how the tomato plant sends out a scent if they have a plage (nature is awesome  ). I don’t know what else to say just watch the video  . The next project he showed was the Hearth Bloom, also a very good project based on data, made with pretty design.

“Heart Bloom is a participatory live-art installation, which offers the audience a biofeedback experience through mechanical movement, sound, and artistic visualisation. Only when you experience excitement or fear you actually feel your heart beat fast inside our chest. However, without you being aware of it, the heart is continually changing its frequency. Biofeedback is a technique that measures physiological processes, and rapidly gives back the data to the users, helping them to be aware of their physiological conditions. Each heartbeat triggers one movement, creating a line or a dot. The variation of the heart rate is demonstrated by the pen’s behaviour in real time. The overall heart rate variability is reflected by the visual characteristics of the generated drawing on paper. Let the heart lead the brush!”

They also now made an app together with the Dutch Hartstichting. I love how this project is a good design together with advertising and data giving people a new insight on there own earth. And now they also made it digital, so everybody can use it, wouw!

Rinus Roelofs – Artist
Rinus is a lover of art and mathematics inspired by Escher, he makes the most complicated designs. [www.rinusroelofs.nl]

I have trouble explaining what he exactly does, but like the first speaker he uses Grasshopper to make is art. He mostly told us that like the image you see above, it looks like it has two layers but if you look really closely you can see that the layers are connected and it is exactly one. I wish I could explain better in text what he does, but you have to actually see what he does to understand it (that was what he was saying during his presentation too)

Bewaren

Bewaren

Bewaren

Bewaren